Analyze and plot loaded CDMs#
In this tutorial, we show how to analyze and plot CDM data.
We assume that data has been loaded (see Basics on how to do it) and that events are stored in the events variable.
import kessler
path_to_cdms_folder='synthetic_cdms'
events=kessler.EventDataset(cdms_dir=path_to_cdms_folder,cdm_extension='.kvn')
#events=EventDataset(path_to_cdms_folder)
/opt/hostedtoolcache/Python/3.9.22/x64/lib/python3.9/site-packages/tqdm/auto.py:21: TqdmWarning: IProgress not found. Please update jupyter and ipywidgets. See https://ipywidgets.readthedocs.io/en/stable/user_install.html
  from .autonotebook import tqdm as notebook_tqdm
Loading CDMS (with extension .kvn) from directory: synthetic_cdms
Loaded 14 CDMs grouped into 2 events
Then, we can first inspect some descriptive statistics and save it to a file:
import pandas as pd
events_stats=events.to_dataframe().describe()
0%| | 0/2 [00:00<?, ?it/s]
100%|██████████| 2/2 [00:00<00:00, 59.72it/s]
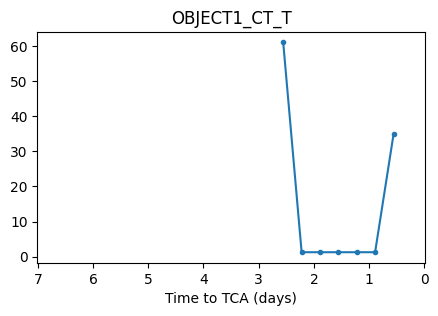
Now, we can proceed in plotting events features. First, we start by plotting a single feature of a specific event (e.g. the 31st one):
events[0].plot_feature('OBJECT1_CT_T', file_name='single_feature_single_event.pdf')
Plotting to file: single_feature_single_event.pdf
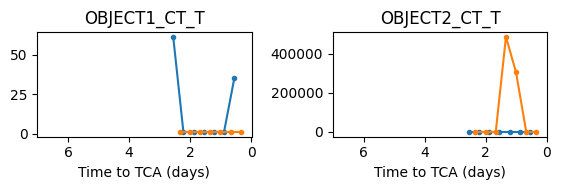
But we can also plot multiple features of multiple events in the same figure:
features=['OBJECT1_CT_T', 'OBJECT2_CT_T']
events.plot_features(features, file_name='multi_features_multi_events.pdf')
Plotting to file: multi_features_multi_events.pdf
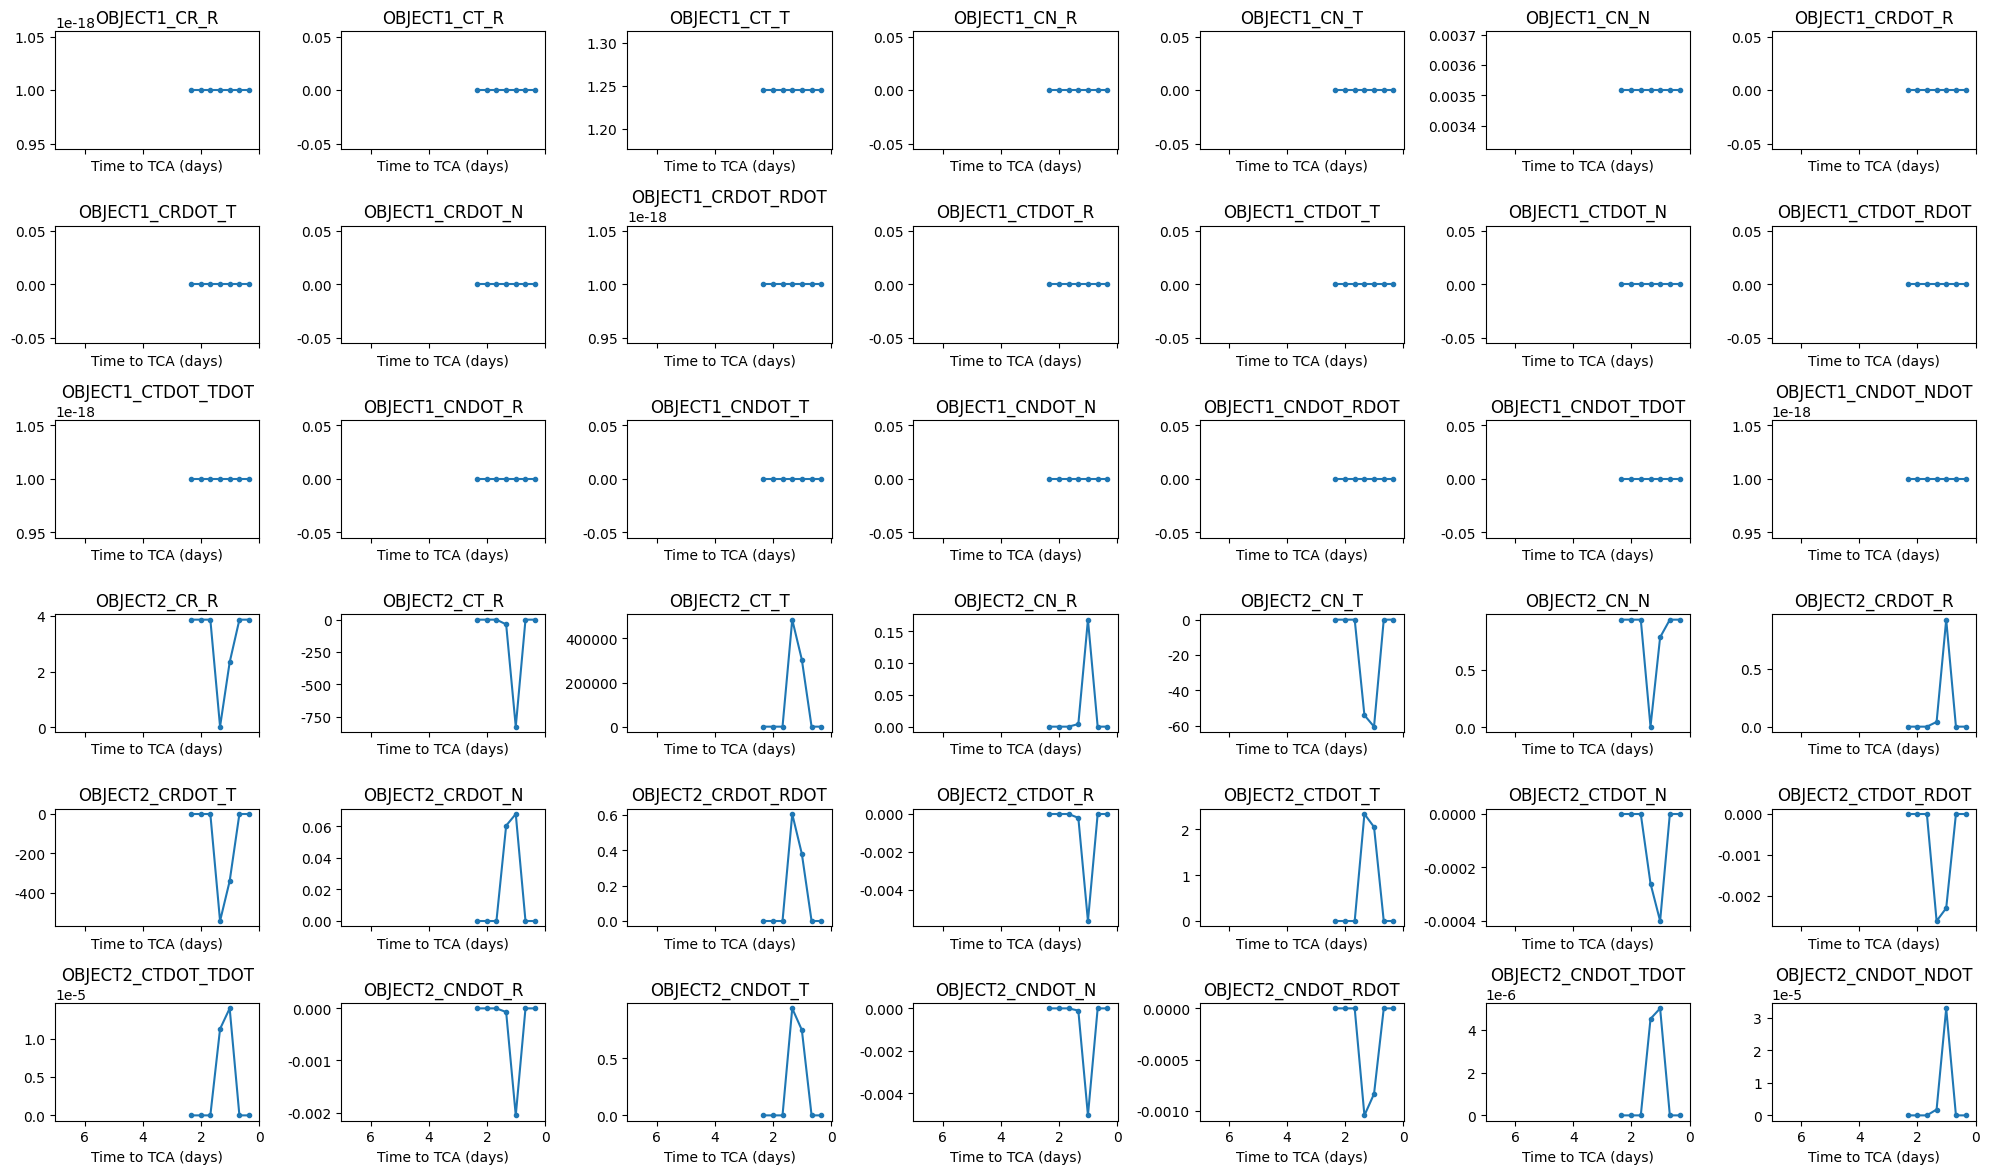
Furthermore, we can leverage a built-in function to plot the covariance matrix evolution of a specific event (all the covariance matrix elements will be plotted in multiple sub-figures):
events[1].plot_uncertainty(file_name='uncertainties_single_event.pdf')
Plotting to file: uncertainties_single_event.pdf
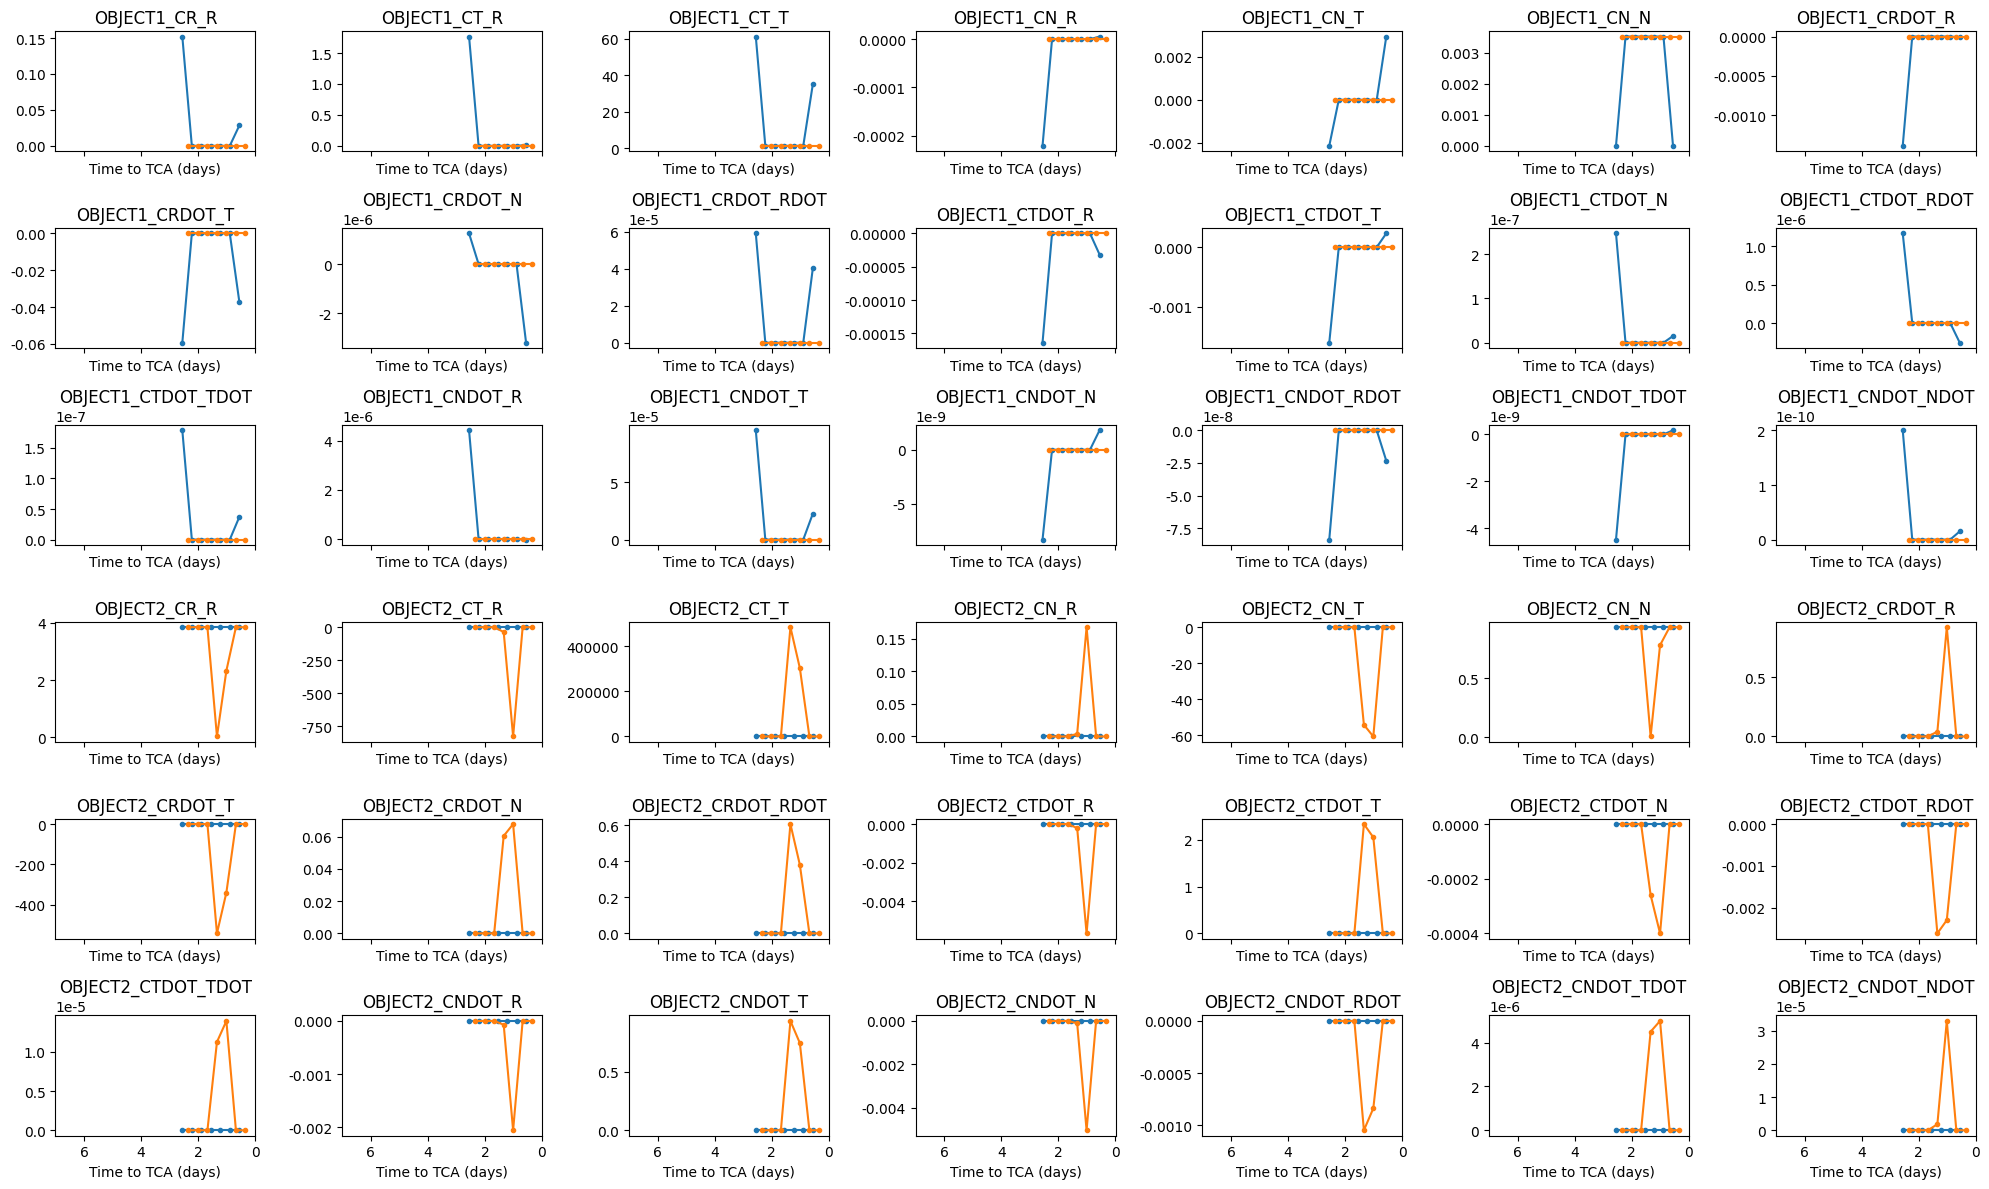
And we can do the same as above, but for all the events:
events.plot_uncertainty(file_name='uncertainties_multi_events.pdf')
Plotting to file: uncertainties_multi_events.pdf
Note that all these plotting methods support an optional apply_func argument that allows to apply a custom lambda function to the data before plotting.